The 6-question TSI is being included in this statewide assessment, led by Impact Consulting in partnership with the New Hampshire State Commission on Aging.

The 6-question TSI is being included in this statewide assessment, led by Impact Consulting in partnership with the New Hampshire State Commission on Aging.
An article published in Social Indicators Research is the first to examine transportation insecurity alongside other forms of material hardship (i.e. food and housing insecurity, utility shutoffs). Findings show that transportation insecurity is among the most prevalent forms of hardship, that the demographic groups likely to experience it are also likely to experience other forms of hardship, that transportation insecurity and food insecurity are the hardships most likely to co-occur with other hardships, and that transportation insecurity is associated with physical and mental health at a similar magnitude as is food insecurity and having unmet medical needs.
Report from Moving Maine shows that in 2024, 2 in 5 Mainers experienced transportation insecurity with rates being notably high among people between 18-24 years of age and those with disabilities. Report details the association between transportation insecurity and economic opportunity, health, and social isolation.
The 6-question Transportation Security Index is being included on a Health and Retirement Study (HRS) transportation module that will be fielded in 2026. The University of Michigan’s HRS is a longitudinal panel study that surveys a representative sample of roughly 20,000 people over the age of 50 in the United States every two years, collecting data on such topics as wealth, health, family connections, work, and more.
Findings from a pilot conducted by the University of Los Angeles’ Lewis Center for Regional Studies showed that although patients who attended a transportation resource fair at the Saban Health Clinic faced numerous transportation barriers in accessing health care, the average transportation insecurity score among those surveyed indicated low insecurity. This data suggests that those with higher insecurity were not able to attend the event. Strategies for reaching patients, including those with high insecurity, are discussed.
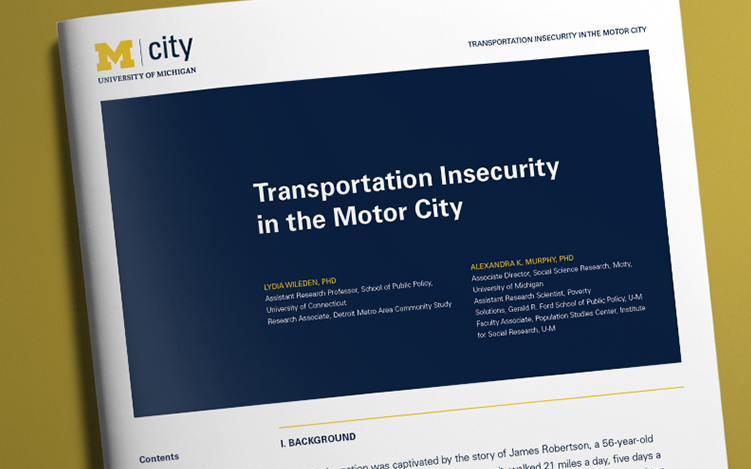
White paper examining what transportation insecurity looks like in Detroit, including its prevalence and its relationship to mode use and transportation costs. Findings show 1 in 3 Detroiters experienced transportation insecurity in 2023.
Findings show that residents with incomes below $49,999 are significantly more likely than those with higher incomes to report skipping trips, rescheduling appointments, not being able to leave the house, and having their relationships impacted because of problems with transportation.
A report examining transportation insecurity among priority populations in King, Pierce, and Snohomish Counties shows that 1 in 5 surveyed experience transportation insecurity and nearly half of respondents with a disability and nearly half of those with low incomes experience moderate/high insecurity.
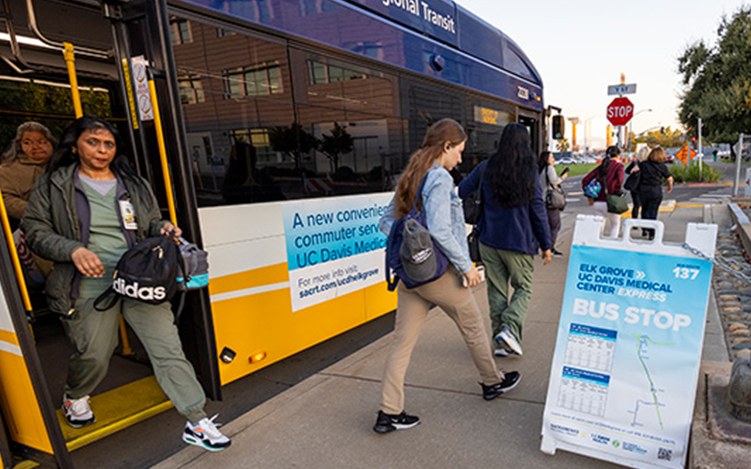
Dialysis treatment typically requires patients to travel to treatment multiple times a week. Health researchers at UC Davis are using the Transportation Security Index to understand how transportation insecurity and different modes of transportation impact dialysis patients’ ability to consistently attend dialysis appointments and how such attendance impacts actual dialysis patient health outcomes.
Survey results examining what transportation insecurity looks like in Minnesota, including how it relates to perceptions around the work of MnDOT. Findings show that 26% of Minnesotans experience transportation insecurity.